|
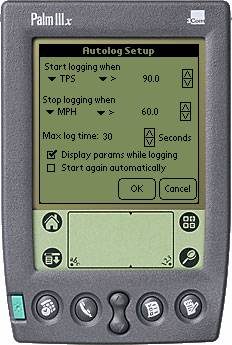
Autolog setup
screen… |
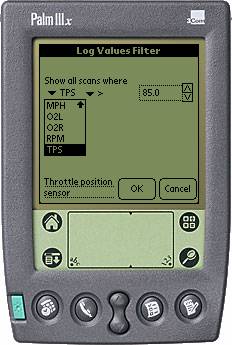
Automatically log dataSet up the criteria you want to automatically start & stop logging data for totally automatic operation. |
|
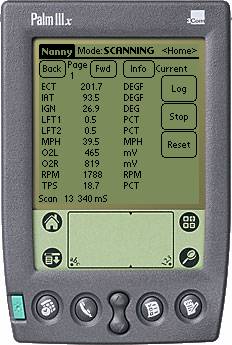
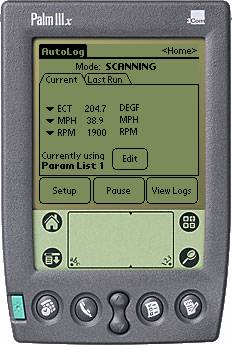
Autolog monitoring screen |
Monitor engine conditionsView current engine data while the scanner waits for the specified conditions to start logging |
|
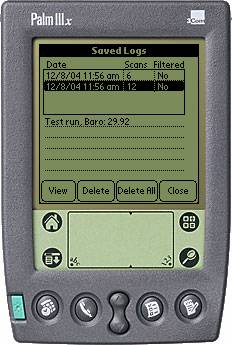
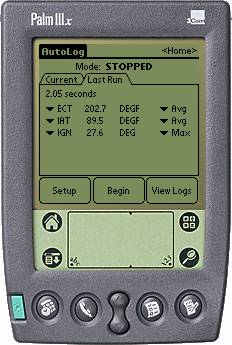
Autolog “Last Run” screen |
Viewing the resultsAfter the data has been recorded, view a summary of engine parameters during the run. You can also view the data on a frame-by-frame basis. |
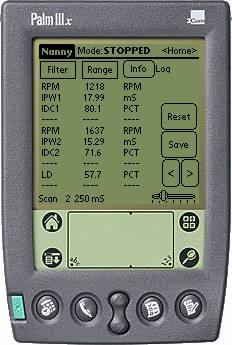
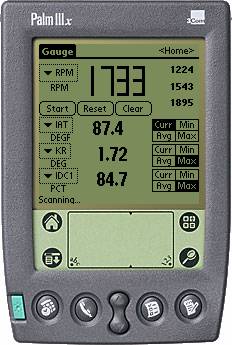
Gauge Screen |
|
Gauge
screen… |
Instant readoutsSimilar to the Nanny screen, but with larger fonts and no logging, the Gauge screen can act as an additional cockpit gauge. Scan one parameter (such as RPM) and get instant min/max/average for that parameter. Also keep track of 3 other parameters at the bottom of the screen. |
|
|
|
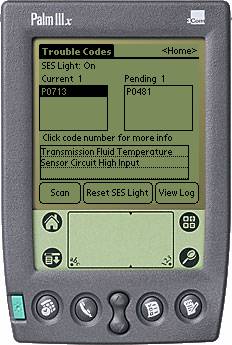
Trouble Codes
|
Trouble
Codes…
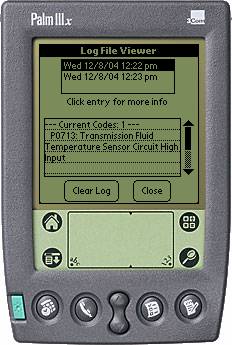
Logged
trouble codes |
Diagnostic trouble codes
Retrieves & displays all current and pending trouble codes and a description from an internal database of over 600 code definitions. Also allows resetting of the SES (Service Engine Soon) light. Will also log activity to an internal database that can be viewed on the Palm or exported to the PC. |
0-60 Test |
|
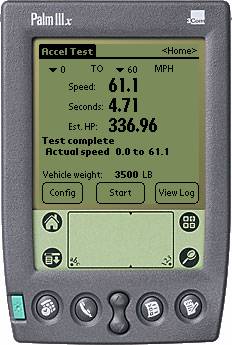
0-60
Mph Accel Test |
Vroooom!
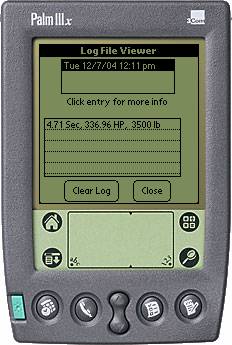
This screen will measure how many seconds it takes your car to go from a standing start to 60mph (start/stop speeds are configurable). It does this by constantly monitoring MPH until it sees movement. It then starts an internal timer & counts the seconds until 60mph is reached. It will display your speed as well as elapsed time, and an estimate of horsepower based on the vehicle weight (user-entered). For example, on the screen shot at left, the scanner counted 4.71 seconds for the vehicle to pass 60 mph, and based on a 3500-lb curb weight, the estimated horsepower to the wheels is 336.96. Each accel test is also logged to an internal file which can be viewed or copied to the computer. |
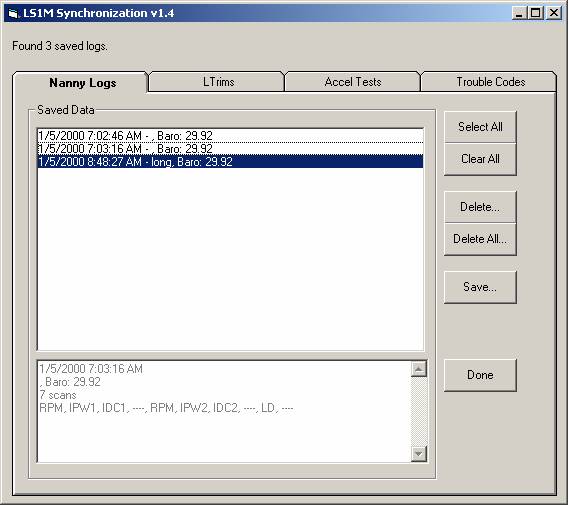
|
Logged
Accel Tests |
|
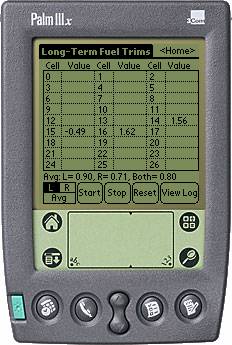
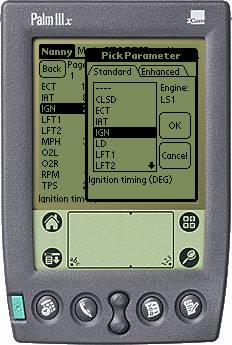
Long-Term Fuel Trims
|
Sample
Screen Shot |
Checking MAF tuning
This screen is used to collect the long-term fuel trims (LFT), which are the adjustments the car’s computer has made under different conditions, in order to maintain a perfect 14.7:1 air/fuel ratio. Each set of conditions is called a cell. Each cell contains two numbers in it, referring to the percent change that has been made to injector duty cycle on the driver’s and passenger side. A positive number means the computer has had to add fuel; a negative number means fuel has been removed. Each cell is listed individually on the chart (cells 0-26 are collected). An average value for all cells is given at the bottom. The results are also saved internally in a log file that can be viewed on the Palm or downloaded to the PC. |
|
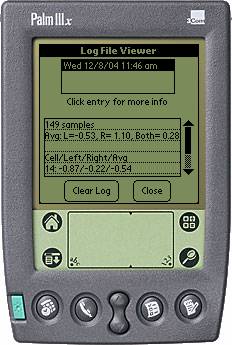
Logged
LTRim Collections |
|